|
458 |
|
NEGenWeb Project
Resource Center
On-Line Library
|
458 |
|
PHYSICAL GEOGRAPHY
WEATHER AND RAINFALL
By G. A. Loveland, U. S. Weather Bureau, Lincoln.
Records of the weather have been kept in Nebraska since 1850. The first settlers manifested an intelligent interest in climatic conditions, but the earliest preserved records were kept mostly at the frontier army posts by the soldiers. In many parts of the state the army posts preceded the settlers. The citizens have been generous with their time and efforts and have recorded weather conditions quite completely for many years.
The following facts have been collected from the voluntary work of Nebraskans for the most part.
Map 1 shows the average or normal annual temperature also the six sections of equal area into which the state has been divided and to which reference is made in the discussion of precipitation.
RAINFALL. The rainfall is perhaps the most important climatic element, and is the one that varies most. Map 2 shows the normal annual precipitation.
The tables give the average annual precipitation for the state and for the different sections, as shown on the map of normal temperatures, for the past year.
The average annual rainfall for the state of Nebraska as a whole is not obtained by averaging the rainfall of all stations in the state without regard to their geographical distribution, since this method would give too large a result, owing to the preponderance of stations in the eastern or wetter portion of the state. To obviate this difficulty the state is divided into six sections of very nearly equal area, as shown on map 1, with the normal annual temperature, and an average is taken of all rainfall data in each section, then these six sectional means are combined, and thus an average for the state is obtained.
The averages for the state and for each section for the year and the crop season, April to August, inclusive, for each year since 1876 are given in Table No. 2.
The averages for the years previous to 1876 are given in Table No. 1 for the year and the crop season. These averages are obtained in a somewhat different manner since there are too few records for the earlier years to make the above method available. Accordingly for these earlier years each station is taken by itself, and, taking account of its geographical position, a ratio is determined by an inspection of the monthly charts of normal precipitation, between the normal rainfall of that locality and the normal rainfall of the state, as a whole this ratio is then used to determine, from the rainfall of a given section for a given month, what amount of rainfall might be taken as a state average for that mouth. An estimate having been made in this manner from each of the stations at which rainfall was measured for that month, these estimates are then averaged and the results given as rainfall for the state as a whole for that month.
This probably gives a fairly reliable estimate of the rainfall of different months, excepting in the very earliest years, when records were kept at only one or very few stations. Even here an estimate of the rainfall of the state made in this way is of considerable value for purposes of comparison with the rainfall of later years.
These monthly amounts have been added to obtain the annual and crop
|
|
459 |
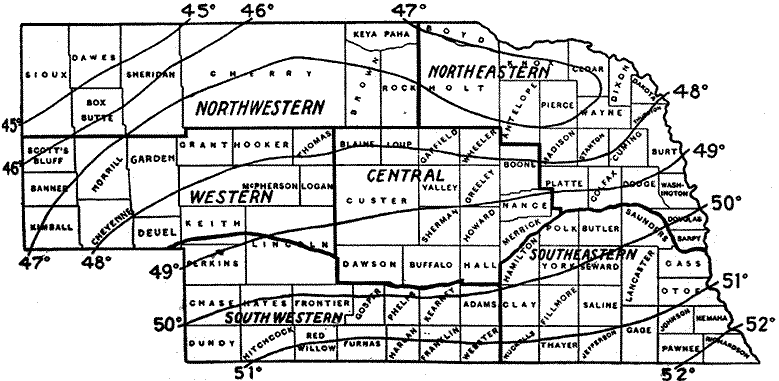
MAP 1--MEAN ANNUAL TEMPERATURE. ALSO SHOWS SECTION BOUNDARIES.
 |
 |
 |
 |