WIND-DISTRIBUTION OF SEEDS.
DATA AS TO WIND-DISTRIBUTION OF SEEDS.
EDWARD M. HUSSONG.
|
250 |
|
house. The temperature changes in the two limbs, on their
being moved in and out of the greenhouse, were noted for several
days. The behavior was practically the same as when the limbs were
attached to the tree. The dead limb was then soaked in water for
some time and the temperature changes of the, two limbs again
observed during both rising and falling temperatures.
These observations show that the rise and fall
of temperature of a dead limb is very appreciably checked on
approaching the freezing point. In short, a soaked dead limb
behaves like a live one, as far as temperature changes are
concerned. There seemed also to be some indication that the
temperature of the soaked dead limb, after having once passed
below the freezing point, falls faster than that of the live limb
below the same point. The later comparisons of the temperature
changes of a live limb and a dead one not soaked are illustrated
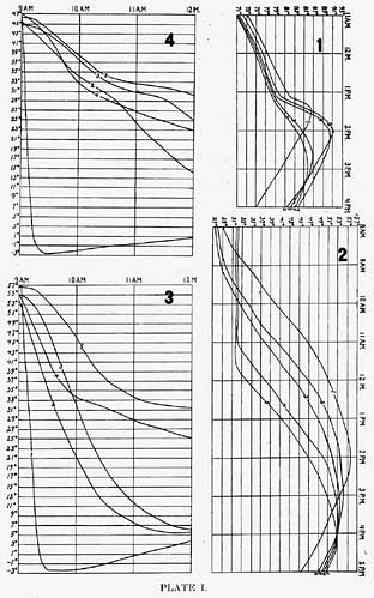
by the diagram for January 26, 1897. (Fig.3.) Alike comparison of
alive limb and a soaked dead one is given by the diagram for
February 26, 1897. (Fig 4.) In both these cases the limbs were
placed out doors at 9 A. M. after having
first acquired a uniform temperature in the greenhouse.
Curve No. I shows the changes in the
temperature of a thermometer in air.
No. 2.--Temperature near surface of dead
limb.
No. 3.--Same at center of dead limb.
No. 4.--Temperature near surface of live limb.
No. 5.--Same at center of live limb.
Limbs shaded till 1:15 P.
M., in sunshine till 2 P. M. Sky
cloudy remainder of day.
No. 1 shows the temperature of air.
No. 2 shows the temperature of surface of dead
limb.
No. 3 shows the temperature of center of dead
limb.
No. 4 shows the temperature of surface of live
limb.
No. 5 shows the temperature of center of live
limb. Limbs shaded by a screen.
No. 1 shows the temperature of air.
No. 2 shows the temperature of surface of dead
limb.
No. 3 shows the temperature of center of dead
limb.
|
|
251 |
No. 4 shows the temperature of surface
of live limb.
No. 5 shows the temperature of center of' live
limb.
Limbs placed outdoors at 9 A.
M.
No. I shows the temperature of air.
No. 2 shows the temperature of surface of soaked
dead limb.
No. 3 shows the temperature of center of soaked
dead limb.
No. 4 shows the temperature of surface of live
limb.
No. 5 shows the temperature of center of live
limb.
Limbs placed outdoors at 9 A.
M.
WIND-DISTRIBUTION OF SEEDS.
DATA AS TO WIND-DISTRIBUTION OF SEEDS.
EDWARD M. HUSSONG.
Few matters are of greater economic
importance than that of how and to what extent the seeds of
flowering plants are distributed by winds. To the ecologist and
phyto-geographer it is one of no moderate interest, as
geographical distribution, though local, is in each of these lines
of modern research no inconspicuous part; to the student of local
florae it accounts partially for the unexpected appearance of
species whose natural habitat has been assigned remote from his
district of special work; while to the agriculturist it affects
vitally his success or failure on the farm.
No available data touching directly upon the
subject have been tabulated; perhaps none have been collected.
Under my direction the students of the Franklin High School have
carried forward for the past three years a series of field
collections and laboratory cultures that have opened the problem
at least to wider investigation. Our work briefly is thus:
We have made exposures of collecting traps in
the various situations afforded us on the high school campus,
around the homes of the students, and in the open prairies and
fields. Leeward and windward positions were selected when previous
indications foretold the direction of the wind; the value of these
different positions is apparent from the widely different results
obtained thus from the same period of observation. The different
situations., as campus, barnyard, prairie, ravine, field, etc.,
give lawful variations which the observer can easily account
for.
The traps used were deep tin cans, anchored fast
by means of stout stakes to which the cans were securely wired in
a manner allowing of easy detachment to remove the contents. Winds
were grossly classified into four groups: breezes, local
winds,
|
254 |
|
high winds, and continued gales; such grouping being
based upon the force and continuance of atmospheric movement. The
trash and dust were carefully removed from the cans and labeled as
to location, date, length and strength of wind. A specimen label
is as follows:
"Harry Davis; open pasture south of Franklin,
one-half mile from tilled soil; continued gale, two days; Oct.
10-11, 1894."
In many instances dates were not recorded, but
the general season-period is known. These omissions have so
affected the calculations that no definite dates can be given in
the tabulation; the early or late season-period, however, is
fairly accurate.
Vegetable mould, calorized to prevent extraneous
growths, was added to the collections and under fair conditions
the seeds contained therein were germinated. Many of the plants
grew to maturity, others developed sufficiently to reveal their
identity, a few were classed "unknown."' The tabulation of results
is not as satisfactory as could be wished, but it suffices to show
the general trend of the investigation.
The. following table shows calculations obtained
from forty-eight collections, 1893-4-5-6, taken during
|
|
|
|
|
|
|
|
|
|
|
|
||
|
1. Portulacacea |
|
|
|
|
|
|
2. Compositae |
|
|
|
|
|
|
3. Amarantaceae |
|
|
|
|
|
|
4. Chenopodiaceae |
|
|
|
|
|
|
5. Plantaginaceae |
|
|
|
|
|
|
6. Asclepeidaceae |
|
|
|
|
|
|
7. Gramineae |
|
|
|
|
|
|
8. Solanaceae |
|
|
|
||
|
9. Cyperaceae |
|
|
|
|
|
|
10. Onagraceae |
|
|
|
|
|
|
11. Cruciferae |
|
|
|
|
|
|
12. Leguminosae |
|
|
|
|
|
|
13. Polygonaceae |
|
|
|
|
|
|
14. Convolvulaceae |
|
|
|
||
|
Unknown |
|
|
|
|
|
|
Totals |
|
|
|
|
|
|
Per cents, by winds |
|
|
|
|
|
|
255 |
A single series of experiments can give
no well-founded results, and may vary widely from the truth;
however, in general it is noticed that breezes and local
winds do not distribute ordinary plant seeds over very great
areas, while oppositely, high winds and continued
gales scatter the seeds widely over pasture and meadow, hill,
ravine, field, and prairie alike.
It is at once noticed in the above table that
the comose seeds, and the pappose and chaffy seed-bearing fruits
are dislodged and scattered by the early fall breezes, the seeds
of the Compositae and the Asclepeidaceae
predominating in numbers. The local winds bear, besides
comose and pappose seeds, those of the Cheopodiaceae and
Amarantaceae, whose presence is very undesirable
economically. High winds do not, as many may suppose, bear
the lighter comose, pappose, and membranaceous seeds in greater
numbers than does it of those of denser structure. Though the
high winds are far more than any others, the seed carriers,
they are also the atmospheric agents that loosen and drift forward
many seeds that are too heavy to be borne within itself above the
soil surface. The cultures of material collected during
continued gales gave very disappointing results. Our
adventive, newly introduced, and "out-of-range" species have come
within out-boundaries by the steady monsonic gales so prevalent
from the north and south, over the plain district of Nebraska,
Kansas, and the Dakotas. The alarming invasion of the "Russian
thistle," Salsola tragus L., in 1894-5, the appearance of
carpet weed, Mollugo verticillata L., throughout the entire
county (Franklin) in 1892, and the occasional growths of wild
carrot., Daucus carrota L.,, are to be attributed to these
continued gales.
A reference to each of the other tables in the
series may not be amiss:
1. The October collections gave 20% more of
Compositae, 8% more of Asclepeidaceae, and a
considerable gain generally in the lighter seeds, especially those
adapted to aerial carriage; arousing a strong suspicion, which
other conditions tend to verify that October is predominantly the
month of local distribution.
|
256 |
|
Gramineae, Amarantaceae, and
Chenopodiaceae each gain from 1 to 3% when dynamic data are
unchanged.
2. The November collections were notable for a
great increase in the Chenopods and Amaranths. These grow mainly
in fields, and ripen early and late. The increase of distribution
of seeds is probably accounted for by this being the mouth of
corn-gathering and stalk-pasturing on the farms. Ofttimes steady
winds prevail during the entire mouth. These two conditions
uniting, the tendency is toward a wider and easier dispersion and
dissemination than during any other month of the year.
3. December and January show very light
movements of seeds, these being buried beneath snow and frozen
fast to the surface. Hence these months are periods of little
importance in the matter under discussion. Lower latitudes would
give data of interest.
4. February and March are also inactive periods.
Collections were abundant in debris, but careful cultures showed
that very few seeds likely to germinate were contained therein.
The reasons are too obvious to necessitate mention.
5. April is the month of active spring work and
coupled with it are our spring monsoons. Operating together, no
light effect in distribution is noticed. In fact., all things
loose tend to fly to the uttermost parts of the earth. Among the
commoner ones, seeds of Garden Purslane, Portulaca oleracea
L., Tansy Mustard, Sisymbrium canescens Nutt., Black
Mustard, Brassica nigra (L.) Koch., Wild Pea, Astragalus
gracilis Nutt., and Winged Dock, Rumex venosus Pursh.,
were unexpectedly present and their prominence in the culture
growths showed them to be in prime condition. A few early
cottonwoods and willows appeared also.
It will be noticed that these data and
compilations are in reference to horizontal variations only.
Though it may prove an error, still it is the popular belief that
the wind distribution of seeds takes place within that stratum of
air that lies about thirty or forty feet from the earth's surface.
Let us hope that investigations may soon give us data as to
vertical variation, that we may know more fully the importance and
service of fences, wind
|
|
257 |
breaks, weather-growths, and hedges toward hindrance and
possible barriers of seed dispersion and dissemination. The old
adage: "An ounce of prevention is better than a pound of cure" is
pertinent to this matter.
[NOTE.--The term
"seed" in this paper applies to the general non-technical use of
the word rather than in a strictly botanical sense. it often
implies those organs technically called fruit cluster and fruit.
E. M. H.]


© 2000, 2001 for NEGenWeb Project by Pam Rietsch, T&C Miller